Writing Task 1 The bar graph shows information about people’s drinking habits in percentages, categorised by their age group in the US. The people who never drink and ex- drinkers are higher than drinkers. It can be seen that about Read More …
Category: Writing Task 1- Graphs
The pie chart shows the amount of energy consumed by an average Australian household.
The two pie charts illustrate the manner of energy use in an average Australian household as well as the discharge of greenhouse gas resulting from this. The majority of usage is for heating. It can be seen that the maximum Read More …
The charts below show the results of a survey of adult education.
IELTS Writing Task 1 Answer: The given charts indicate the findings of adult education, as to why adults study as well as people’s view on how they believe the cost of the same ought to be shared. Majority of adults Read More …
The diagram shows how electricity is generated in a hydroelectric power station.
The diagram illustrates the process of generating power in a hydroelectric power station. River water is utilised to generate power in the day that is sent to the national grid, whereas at night the water is pumped back into the Read More …
The chart below shows one country’s exports in various categories during 2015 and 2016
The given bar graph depicts the export earnings of a country in various categories during 2015 and 2016, while the table illustrates the percentage of change in values in the two years. The largest export earnings were from petroleum products. Read More …
The diagram shows how electricity is generated in a hydroelectric power station.
The diagram illustrates the process of generating power in a hydroelectric power station. River water is utilised to generate power in the day that is sent to the national grid, whereas at night the water is pumped back into the Read More …
The bar chart shows the percentage of Australian men and women in different age groups who did regular physical activity in 2010.
Writing Task 1 The given bar graph depicts the amount of regular bodily activity performed by Australian men and women in percentage, in 2010. A higher percentage of 25 to 64 year old women did physical activities regularly, vis-a-vis men Read More …
The diagram shows the manufacturing process for making sugar from sugar cane
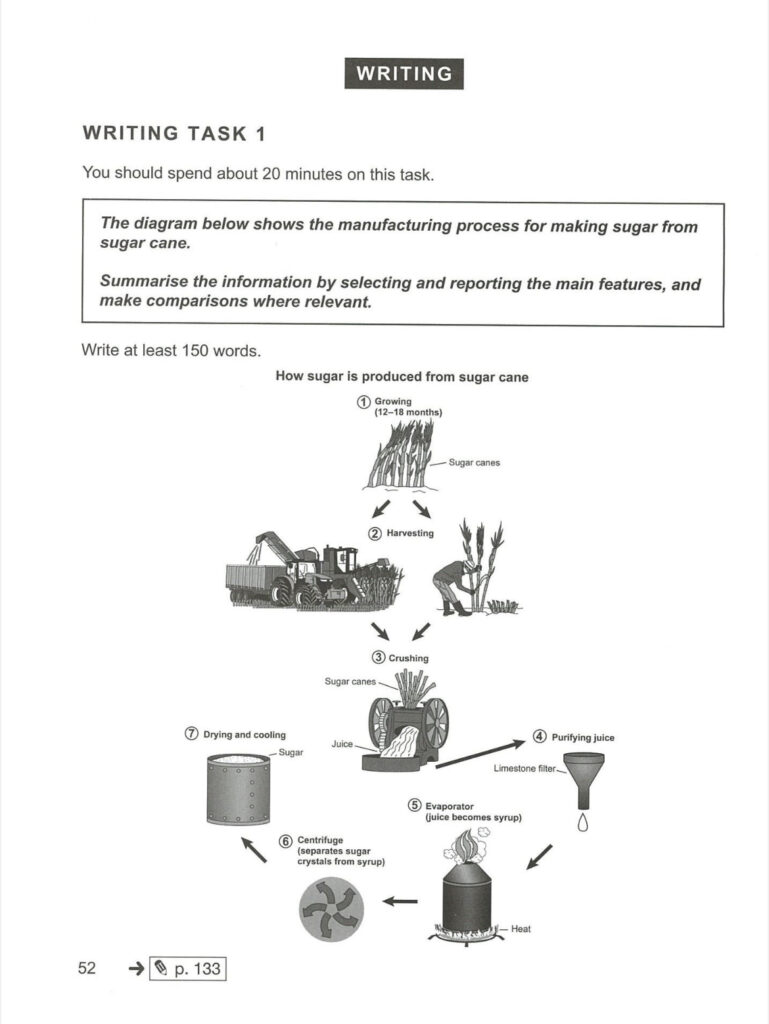
The given process chart depicts how sugar is made from raw sugarcane. There are seven crucial steps in the production of sugar in a form that is consumed by people. The very first step involves growing sugarcane, which takes around Read More …
The bar chart illustrates the total number of minutes of telephone calls in the UK…
The bar chart depicts the different types of telephone calls made by UK citizens from 1995-2002. Maximum calls were locally on fixed lines. It can be seen that in 1995, highest number of calls(around 72 billion minutes) were done locally Read More …
The table shows the proportion of different categories of families living in poverty in Australia in 1999.
The table provided shows the percentage of various household types that lived in poverty in Australia in1999. Aged couple families were comparatively far better off than other family types, as opposed to sole parents who were most poor. It could Read More …