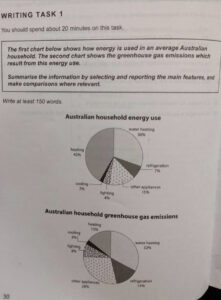
The two pie charts illustrate the manner of energy use in an average Australian household as well as the discharge of greenhouse gas resulting from this. The majority of usage is for heating.
It can be seen that the maximum quantity of energy used in Australian houses is for heating (42%) and water heating (30%). Whereas, the greenhouse gas emission is mostly due to water heating (32%) and only 15% by heating. Besides, 15% of energy is consumed by other appliances and 7% in refrigeration. The greenhouse gas produced is approximately twice the percentage of energy usage by other appliances(28%) and refrigeration (14%).
The lowest amount of energy is consumed by lighting (4%) and cooling (2%). The emission of greenhouse gases is twice in lighting (8%) and just 3% released during cooling.
To conclude, around three fourths of energy is consumed for water heating, heating and lighting which together create about more than half of green house gases.