Writing Task 1
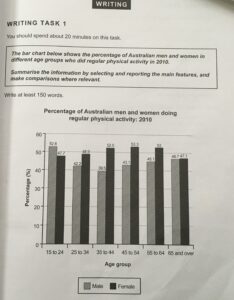
The given bar graph depicts the amount of regular bodily activity performed by Australian men and women in percentage, in 2010. A higher percentage of 25 to 64 year old women did physical activities regularly, vis-a-vis men in the same age bracket.
It can be seen that more of 15 to 24 year old males ( 52.8%) rather than females(about 5% lesser) , performed bodily actions. In the 25 to 34 year old bracket, there was a sudden reversal and a 10% drop in males and greater percentage (48.9%) of women engaging in frequent physical actions. In the 35 to 44 year olds, regularity of body activity was observed in even fewer men( only 39.5%) but the highest in women( 52.5%). In men and women of 45 to 54 year olds as well, more women( about 53%) took to physical activity as opposed to men( around 44%). Nevertheless, 46.7% of 65 and above men and 0.4% more women were involved in frequent physical activity.
Overall, the highest difference in regular physical activity by men and women was observed in the 35 to 45 age group Australians.

